
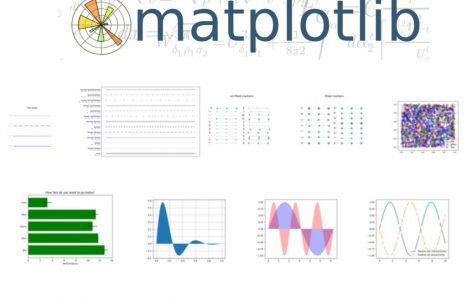
Matplotlib: Lines, bars, pie charts and some other stuff
Why do I start from Matplotlib and data visualization? Well, maybe because my first academic degree is in Geodesy and Cartography, so visualized data tells me much more than just raw statistics, or maybe because this is just an easy starting point… Anyway, It should be enough to just take …